
PSL Score: What It Means, the 0–8 Scale and Where You Stand
A PSL score places a face on a 0–8 attractiveness scale where the statistical middle is pinned to 4.0 — deliberately stricter than the casual 1–10 ratings you are used to. This page explains every band, the distribution, and the conversion, with a real measured example.
What is a PSL score?
A PSL score is a facial rating on a 0–8 scale that originated in looksmaxxing communities (the name comes from early rating forums). Unlike a casual 1–10 rating — where the effective middle has drifted upward for decades — the PSL scale is anchored: 4.0 is the statistical median by construction, and each band above it is rarer than the last.
Two things a PSL score is not: it is not a verdict on your worth, and it is not a single immutable number. It is a measurement of one photo's geometry — here is exactly how that measurement works.
The 0–8 scale, every band explained
| Range | Tier | Rough population share | Read |
|---|---|---|---|
| 6.5 – 8 | Chad / Stacy | ~0.1% | Model-tier structure; the ceiling of the scale |
| 6 – 6.5 | Chadlite / Stacylite | ~1% | Clearly model-adjacent; strong vertical support |
| 5 – 6 | HTN (High-Tier Normie) | ~10% | Attractive; noticeably above average |
| 3.5 – 5 | MTN (Mid-Tier Normie) | the bulk | The middle of the bell curve — a 4.4 is not an insult |
| 2 – 3.5 | LTN (Low-Tier Normie) | ~15% | Below average; very responsive to grooming and photos |
| 0 – 2 | Very Low | rare | Severe disharmony in the measured geometry |
Detailed breakdowns per band live on the PSL tier list, with the community vocabulary — Chadlite, HTN, LTN, PSL god — defined in the dictionary.
The distribution: why the median is 4.0
Casual ratings inflate: on most platforms the effective middle sits around 6.5/10 and everything below 5 reads as harsh. The PSL curve resists that drift by anchoring 4.0 to the population median and compressing the top — which is why a PSL 6 feels rarer than a casual 9.
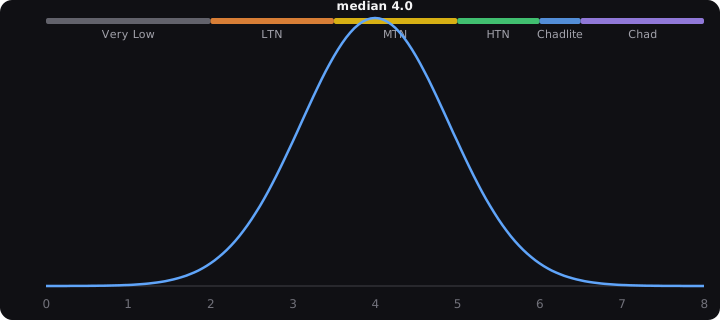
The practical consequence: deltas matter more than absolutes. Moving from 4.2 to 4.8 is a real, visible change even though both "sound middle-of-the-road."
PSL score vs casual 1–10
The community conversion is roughly +2.4:
| PSL | Casual ≈ | Read |
|---|---|---|
| 2.0 | 4.4 | LTN |
| 3.0 | 5.4 | Low MTN |
| 4.0 | 6.4 | Median |
| 5.0 | 7.4 | Upper MTN |
| 6.0 | 8.4 | HTN |
| 6.5 | 8.9 | Chadlite |
| 7.5+ | 9.9+ | Chad |
Full side-by-side with usage guidance: PSL vs the 1–10 scale.
Example: a real measured report
This is the engine's actual output for an AI-generated reference face — not a mockup:
- PSL 4.7 / 8 (MTN · Mid-Tier Normie) — casual 7.1 / 10, top 22%
- Strongest dimension: Symmetry 95 · weakest: Golden Ratios 35
- Five-dimension radar: symmetry 95, proportions 56, structure 28, eyes 58, harmony 39
Note the shape: a clear weak metric, still a mid-scale total — one weak feature is not a verdict, and the score is a weighted whole.
Check your own score
The measurement is free, instant and runs entirely on your device — no account, no upload:
Standardize your conditions (front-on, neutral, even light) before you judge the number — and if you plan to track change, use the PSL test protocol so your deltas mean something.
FAQ
Answers inline above cover the common questions — what's good, what's average, the 1–10 conversion, whether the scale is male-only, and whether scores change. If one is missing, the PSL scale guide goes deeper on the system itself, and the methodology page publishes every formula behind the measurement.